Some time back an article was published on the GridViewGuy which demonstrated how to draw graphs/charts using the WebChart control. You can view the article here. In this article we are going to use the .NET graphics API to create a bar graph.
Introduction:
Some time back an article was published on the GridViewGuy which demonstrated how to draw graphs/charts using the WebChart control. You can view the article here. In this article we are going to use the .NET graphics API to create a bar graph.
The Data Source:
The first task is to set up a container. I will be using a custom entity named ExamData.
The entity will be populated with custom data. The following code shows how to populate the custom entity.
List<ExamData> data = new List<ExamData>()
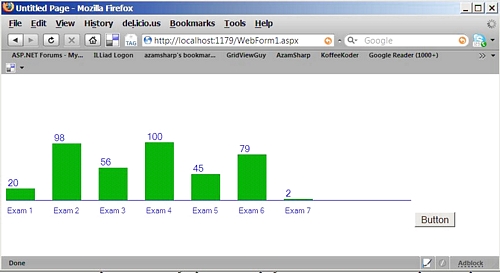
{ new ExamData() { Name = "Exam 1", Score = 20 },
new ExamData() { Name = "Exam 2", Score = 98 },
new ExamData() { Name = "Exam 3", Score = 56 },
new ExamData() { Name = "Exam 4", Score = 100},
new ExamData() { Name = "Exam 5", Score = 45},
new ExamData() { Name = "Exam 6", Score = 79},
new ExamData() { Name ="Exam 7", Score = 2}
};
As you can see in the above code that the exam data class contains two properties one is the name and the other one is the score.
The next task is to publish the graph on the page. Let's view the complete implementation.
private void PublishGraph()
{
var data = GetData();
Bitmap bitmap = new Bitmap(GetGraphCanvasWidth(data.Count), CANVAS_HEIGHT);
Graphics g = Graphics.FromImage(bitmap);
g.FillRectangle(Brushes.White, 0, 0, GetGraphCanvasWidth(data.Count),
CANVAS_HEIGHT);
int margin = 0;
foreach (var item in data)
{
Rectangle r = new Rectangle(new Point() { X = margin, Y =
GetGraphRectangleYAxis(bitmap.Height, (int)item.Score) }, new Size(BAR_GRAPH_WIDTH, (int)
item.Score));
// This is to create the base line!
Rectangle hr = new Rectangle(new Point() { X = 0, Y = 210 }, new Size
(GetGraphCanvasWidth(data.Count), 1));
g.FillRectangle(Brushes.Green, r);
g.FillRectangle(Brushes.Blue, hr);
g.DrawString(item.Score.ToString(), new Font("Verdena", 10), Brushes.Blue,
new PointF(r.X, r.Y - 20));
g.DrawString(item.Name, new Font("Verdena", 8), Brushes.Blue, new PointF
(r.X, 220));
margin += GRAPH_MARGIN;
}
bitmap.Save(Response.OutputStream, ImageFormat.Gif);
}
In the code above we are creating a Bitmap object and providing it with the custom width and height. The width is based on the number of items in the data container. Next the graphics object is created from the bitmap object. A rectangle is created on the bitmap with white color. Next we iterate the collection of the data container. Inside the foreach loop we are creating the bar chart using rectangles. You will also notice that we are creating a base line for the graph. The baseline will separate the graph from the custom message that we will display on the screen. We used multiple brushes to fill the rectangles and draw the custom text on the screen. Finally, the bitmap is saved on the response stream which is later displayed by the browser.
Now, fire up your Internet explorer and view the page and it will display the graph as expected but when you view the page using FireFox it will display arbitary characters on the screen. This is the because the FireFox does not know how to display the content on the page. You need to tell FireFox what type of content you are trying to view. This can be fixed by providing the Response header of the Content-Type attribute. Check out the code below in which the Content-Type attribute is added to the response header.
Response.AddHeader("Content-Type", "image/gif");
bitmap.Save(Response.OutputStream, ImageFormat.Gif);
With the content type attribute set in place the Internet Explorer as well as FireFox will display the correct result.
One thing you will notice is that when you display the graphs on the page you will not be able to view the source of the page. The reason is that the graph is displayed as a binary response and not an HTML element. A better way to display the image is to create a separate page which will dynamically generate the image. Later the result of that page is displayed on the target page using the HTML image tag.
In our case the ImagePage.aspx will serve as a page which will dynamically generate the image and WebForm1.aspx will serve as the page which displays the image. Take a look at the following image tag that is embedded inside the WebForm1.aspx page.
<img src="ImagePage.aspx" visible="false" runat="server" id="myimg" />
Now when you run the page the image tag makes a request to the "ImagePage.aspx" page which gets executed and generates the graph. If you are using the technique explained above then you do not need to add the content-type headers.
Conclusion:
In this article we learned how to create the bar graphs using the graphics API provided by the .NET framework. I hope you liked the article happy programming!