Memory management can make or break your iPhone applications. If your app is leaking memory then it is only a matter of time that it will eventually slow down or even crash. In this article we are going to demonstrate the reasons for memory leaks and how to stop leaks from happening.
Garbage Collection:

If you are coming from C# or Java background then you are a spoiled brat! We meant that in the nicest way! C# and Java performs automatic memory management and garbage collection. In iPhone development the developer is responsible for managing the memory. The problems associated with memory leaks are usually classified into two factors:

1) Premature Deallocation

Premature Deallocation happens when you return memory to the heap even though part of the program is still using it.

2) Memory Leaks    

When memory is not being used by any part of the program but it is not freed so that the memory can be used again.

Reference Counting:

The technique used to make sure that the object is ready to be released is called reference counting. When the object gets created the reference count is incremented to 1. When another object gets hold of the same object the reference count is incremented to 2. When the owner of the object no longer reference the object then the reference count is decremented till the reference count has reached 0 and at that point it is returned to the heap.

A Deeper Look:

In order to get a deeper understanding of memory leaks we will be using a Cocos2d project. We have added our custom class called "Spaceship" as shown below:


The Spaceship object is used in the "HelloWorldLayer.m" file as shown below:


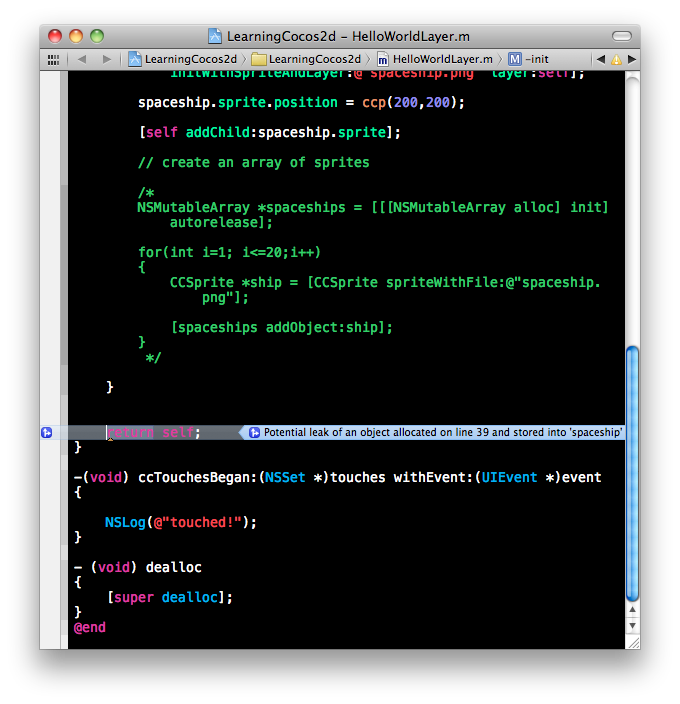
In the implementation above we are creating an instance of the Spaceship class but we are not releasing it. This will cause a memory leak in the application. You can always check these leaks using the Analyze option under the Product. The screenshot below shows the message from the xCode telling the developer about a possible memory leak.


You can use autorelease keyword with the Spaceship initialization which will insert the Spaceship object in the auto release pool handled by the NSAutoReleasePool class. The NSAutoReleasePool class periodically checks the objects that are marked to be auto released. The implementation is shown below:


Now, since the spaceship instance is marked with autorelease it will be released by the NSAutoReleasePool and you will not get those pesky memory leak warnings.

There are times when you are exposing the object using a property. For these scenarios you must remember to release the objects. The HelloWorldLayer can expose the Spaceship object as a property as shown below:


The dealloc method is shown below:


One thing you will notice is that we are setting the spaceship reference to nil even though we have released it. This is because the pointer is still pointing to that memory location. The nil allows the pointer to reset.

Zombies:

There are times when you try to access an already released object. Of course you cannot excess an entity if it does not exist so this throws an exception. Unfortunately, the exception message is not very clear and it sends new developers on a wild goose chase.

Remove the property declaration of Spaceship from HelloWorldLayer and just keep the instance variable. Set the spaceship as auto released object as shown in the code below:


Now, try to access the spaceship object in the ccTouchesBegin event:


The above code will throw an exception because the spaceship object has already been released. The exception is shown below:

EXC_BAD_ACCESS

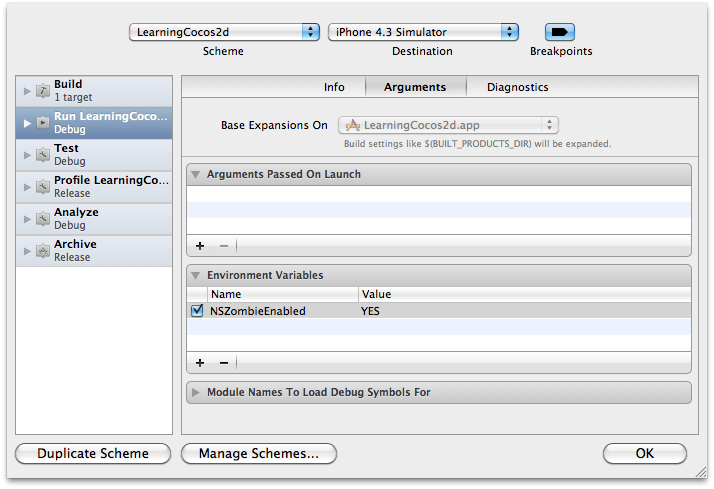
You can shorten your goose chase by setting the NSZombieEnabled to YES. This will help you to find your problem much quicker. Click on Edit Schema under Product and add a new environment variable by clicking the "+" sign.


Run the application again and now the error is more informative as shown below:


Using Profiler to Catch Those Nasty Leaks:

When everything fails you can rely on Profiler to catch memory leaks. We have used Profiler exclusively to resolve memory issues related to "Mathemachicken" iPhone app. Let's first create a big memory leak and then check it out in the Profiler. In the following implementation we are creating the CCSprite objects in the NSMutableArray but we are not releasing the objects or the array which will cause memory leaks.


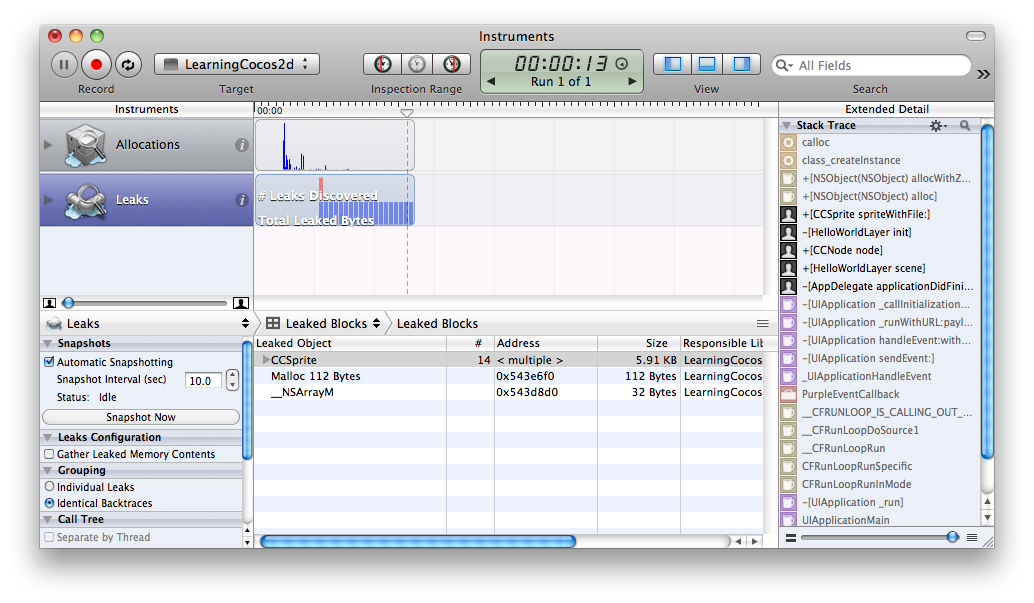
Now, run the app using Profiler (Product -> Profile). Select the "Leaks" option from the second screen. The Profiler will immediately start looking for memory leaks. The screenshot below shows culprits found using Profiler:


The additional information on the right pane is displayed using the "Extended Detail" option in the "View" option. The faded items identifies the SDK code and the bold items represent your code or the third party framework code. Try your best to remove the memory leaks which occurred due to your code.    

Conclusion:

In this article we learned the basics of memory management in iPhone development. Memory management is an important step of app development and should be handled very seriously.